Air travel can be a source of stress, even for experienced travelers who are used to completing tasks such as checking bags and finding gates before settling into their plane seats.
As a data scientist, you may be called upon to use your skills to help airlines assess whether there are opportunities to improve the customer journey and turn negative experiences into positive ones. By using data analysis and visualization techniques, companies can quickly and consistently respond to customer feedback in a way that is aligned with their brand values and business objectives.
Python is a vital tool for many data science projects, as it allows for the access, manipulation, and analysis of data. There are also several libraries available, such as BeautifulSoup, matplotlib, and TextBlob, that offer a wide range of functionality for tasks such as data scraping, review, categorization, visualization, and sentiment analysis.
For this project, we will gather data by scraping it from [https://www.airlinequality.com], a trustworthy source for airline business reviews.
We will specifically be collecting reviews for Royal Air Maroc, British Airways, United Airlines and Qatar Airlines.
With BeautifulSoup library, we will gather all the links to the reviews and then extract the text data from each individual review link.
Note: Importing necessary libraries.
import pandas as pd
import requests
from bs4 import BeautifulSoup
from dateutil import parser
import matplotlib.pyplot as plt
from textblob import TextBlob
from collections import Counter
from openpyxl import Workbook
Note: Scraping Royal air Maroc Data (Africa).
url: https://www.airlinequality.com/airline-reviews/royal-air-maroc/page/1/?sortby=post_date%3ADesc&pagesize=100
base_url = f"https://www.airlinequality.com/airline-reviews/royal-air-maroc"
pagesize = 100
pages = 5
airline = f"RAM"
region = f"Africa"

# Create an empty DataFrame
dm = pd.DataFrame(columns=['Date', 'Region', 'Airline', 'Title', 'Rating', 'Date Flown', 'Recommended', 'Review'])

for i in range(1, pages+1):
    url = f"{base_url}/page/{i}/?sortby=post_date%3ADesc&pagesize={pagesize}"
    response = requests.get(url)
    content = response.content
    soup = BeautifulSoup(content, 'html.parser')

    for div in soup.find_all("article", itemprop="review"):

        rating = div.find("span", itemprop="ratingValue")
        rating = rating.text if rating else "N/A"

        title = div.find("h2", class_="text_header").get_text().strip('"')

        date = div.find("time", itemprop="datePublished")
        if date:
            date = parser.parse(date.text)
            date = date.strftime('%Y-%m-%d')
        else:
            date = "N/A"

        review = div.find("div", class_="text_content").get_text().strip('✅')

        traveller = div.find("td", class_="review-rating-header type_of_traveller")
        traveller = traveller.text if traveller else "N/A"

        tr = div.find("td", text="Date Flown")
        if tr:
            tr = tr.find_parent("tr")
            date_flown = tr.find("td", class_="review-value")
            date_flown = date_flown.text if date_flown else "N/A"
            if date_flown:
                date_flown = parser.parse(date_flown)
                date_flown = date_flown.strftime('%Y-%m-%d')
            else:
                date_flown = "N/A"
        else:
            date_flown = "N/A"


        tr = div.find("td", class_="review-rating-header recommended")
        if tr:
            tr = tr.find_parent("tr")
            recommended = tr.find("td", class_=lambda x: x and x.startswith("review-value rating-"))
            recommended = recommended.text if recommended else "N/A"
        else:
            recommended = "N/A"


        # Append the data to the DataFrame
        dm_new_row = pd.DataFrame({'Region': [region],'Airline': [airline],'Rating': [rating], 'Title': [title], 'Date': [date], 'Review': [review], 'Date Flown': [date_flown], 'Recommended': [recommended]})
        dm = pd.concat([dm, dm_new_row])

dm.head(3)
Result.
| Date | Region | Airline | Title | Rating | Date Flown | Recommended | Review | |
|---|---|---|---|---|---|---|---|---|
| 1 | 2023-01-23 | Africa | RAM | customer service | 1 | 2022-05-23 | no | Not Verified - … |
| 2 | 2023-01-16 | Africa | RAM | Worst airline | 1 | 2022-12-23 | no | Trip Verified |… |
| 3 | 2023-01-09 | Africa | RAM | loss of luggage | 1 | 2022-12-23 | no | Trip Verified |… |
Note: Scraping British Airways Data (Europe).
url: https://www.airlinequality.com/airline-reviews/british-airways/page/1/?sortby=post_date%3ADesc&pagesize=100
base_url = f"https://www.airlinequality.com/airline-reviews/british-airways"
pagesize = 100
pages = 45
airline = f"BA"
region = f"Europe"

# Create an empty DataFrame
db = pd.DataFrame(columns=['Date', 'Region', 'Airline', 'Title', 'Rating', 'Date Flown', 'Recommended', 'Review'])

for i in range(1, pages+1):
    url = f"{base_url}/page/{i}/?sortby=post_date%3ADesc&pagesize={pagesize}"
    response = requests.get(url)
    content = response.content
    soup = BeautifulSoup(content, 'html.parser')

    for div in soup.find_all("article", itemprop="review"):

        rating = div.find("span", itemprop="ratingValue")
        rating = rating.text if rating else "N/A"

        title = div.find("h2", class_="text_header").get_text().strip('"')

        date = div.find("time", itemprop="datePublished")
        if date:
            date = parser.parse(date.text)
            date = date.strftime('%Y-%m-%d')
        else:
            date = "N/A"

        review = div.find("div", class_="text_content").get_text().strip('✅')

        traveller = div.find("td", class_="review-rating-header type_of_traveller")
        traveller = traveller.text if traveller else "N/A"

        tr = div.find("td", text="Date Flown")
        if tr:
            tr = tr.find_parent("tr")
            date_flown = tr.find("td", class_="review-value")
            date_flown = date_flown.text if date_flown else "N/A"
            if date_flown:
                date_flown = parser.parse(date_flown)
                date_flown = date_flown.strftime('%Y-%m-%d')
            else:
                date_flown = "N/A"
        else:
            date_flown = "N/A"


        tr = div.find("td", class_="review-rating-header recommended")
        if tr:
            tr = tr.find_parent("tr")
            recommended = tr.find("td", class_=lambda x: x and x.startswith("review-value rating-"))
            recommended = recommended.text if recommended else "N/A"
        else:
            recommended = "N/A"


        # Append the data to the DataFrame
        db_new_row = pd.DataFrame({'Region': [region],'Airline': [airline],'Rating': [rating], 'Title': [title], 'Date': [date], 'Review': [review], 'Date Flown': [date_flown], 'Recommended': [recommended]})
        db = pd.concat([db, db_new_row])

db.head(3)
Result.
| Date | Region | Airline | Title | Rating | Date Flown | Recommended | Review | |
|---|---|---|---|---|---|---|---|---|
| 1 | 2023-01-21 | Europe | BA | flight the worst | 2 | 2022-12-23 | no | Trip Verified - … |
| 2 | 2023-01-19 | Europe | BA | race to the bottom | 3 | 2023-01-23 | no | Not Verified |… |
| 3 | 2023-01-19 | Europe | BA | ticket and rebook | 2 | 2023-01-23 | no | Not Verified |… |
Note: Scraping United Airlines Data (USA).
url: https://www.airlinequality.com/airline-reviews/united-airlines/page/1/?sortby=post_date%3ADesc&pagesize=100
base_url = f"https://www.airlinequality.com/airline-reviews/united-airlines"
pagesize = 100
pages = 45
airline = f"UA"
region = f"America"

# Create an empty DataFrame
du = pd.DataFrame(columns=['Date', 'Region', 'Airline', 'Title', 'Rating', 'Date Flown', 'Recommended', 'Review'])

for i in range(1, pages+1):
    url = f"{base_url}/page/{i}/?sortby=post_date%3ADesc&pagesize={pagesize}"
    response = requests.get(url)
    content = response.content
    soup = BeautifulSoup(content, 'html.parser')

    for div in soup.find_all("article", itemprop="review"):

        rating = div.find("span", itemprop="ratingValue")
        rating = rating.text if rating else "N/A"

        title = div.find("h2", class_="text_header").get_text().strip('"')

        date = div.find("time", itemprop="datePublished")
        if date:
            date = parser.parse(date.text)
            date = date.strftime('%Y-%m-%d')
        else:
            date = "N/A"

        review = div.find("div", class_="text_content").get_text().strip('✅')

        traveller = div.find("td", class_="review-rating-header type_of_traveller")
        traveller = traveller.text if traveller else "N/A"

        tr = div.find("td", text="Date Flown")
        if tr:
            tr = tr.find_parent("tr")
            date_flown = tr.find("td", class_="review-value")
            date_flown = date_flown.text if date_flown else "N/A"
            if date_flown:
                date_flown = parser.parse(date_flown)
                date_flown = date_flown.strftime('%Y-%m-%d')
            else:
                date_flown = "N/A"
        else:
            date_flown = "N/A"


        tr = div.find("td", class_="review-rating-header recommended")
        if tr:
            tr = tr.find_parent("tr")
            recommended = tr.find("td", class_=lambda x: x and x.startswith("review-value rating-"))
            recommended = recommended.text if recommended else "N/A"
        else:
            recommended = "N/A"


        # Append the data to the DataFrame
        du_new_row = pd.DataFrame({'Region': [region],'Airline': [airline],'Rating': [rating], 'Title': [title], 'Date': [date], 'Review': [review], 'Date Flown': [date_flown], 'Recommended': [recommended]})
        du = pd.concat([du, du_new_row])

du.head(3)
Result.
| Date | Region | Airline | Title | Rating | Date Flown | Recommended | Review | |
|---|---|---|---|---|---|---|---|---|
| 1 | 2023-01-23 | America | UA | absolutely horrible | 1 | 2023-01-23 | no | Trip Verified - … |
| 2 | 2023-01-23 | America | UA | disappointment | 1 | 2023-01-23 | no | Not Verified |… |
| 3 | 2023-01-21 | America | UA | never travel United | 1 | 2023-01-23 | no | Trip Verified |… |
Note: Scraping Qatar Airways Data (ASIA).
url: https://www.airlinequality.com/airline-reviews/qatar-airways/page/1/?sortby=post_date%3ADesc&pagesize=100
base_url = f"https://www.airlinequality.com/airline-reviews/qatar-airways"
pagesize = 100
pages = 22
airline = f"QTR"
region = f"Asia"

# Create an empty DataFrame
dq = pd.DataFrame(columns=['Date', 'Region', 'Airline', 'Title', 'Rating', 'Date Flown', 'Recommended', 'Review'])

for i in range(1, pages+1):
    url = f"{base_url}/page/{i}/?sortby=post_date%3ADesc&pagesize={pagesize}"
    response = requests.get(url)
    content = response.content
    soup = BeautifulSoup(content, 'html.parser')

    for div in soup.find_all("article", itemprop="review"):

        rating = div.find("span", itemprop="ratingValue")
        rating = rating.text if rating else "N/A"

        title = div.find("h2", class_="text_header").get_text().strip('"')

        date = div.find("time", itemprop="datePublished")
        if date:
            date = parser.parse(date.text)
            date = date.strftime('%Y-%m-%d')
        else:
            date = "N/A"

        review = div.find("div", class_="text_content").get_text().strip('✅')

        traveller = div.find("td", class_="review-rating-header type_of_traveller")
        traveller = traveller.text if traveller else "N/A"

        tr = div.find("td", text="Date Flown")
        if tr:
            tr = tr.find_parent("tr")
            date_flown = tr.find("td", class_="review-value")
            date_flown = date_flown.text if date_flown else "N/A"
            if date_flown:
                date_flown = parser.parse(date_flown)
                date_flown = date_flown.strftime('%Y-%m-%d')
            else:
                date_flown = "N/A"
        else:
            date_flown = "N/A"


        tr = div.find("td", class_="review-rating-header recommended")
        if tr:
            tr = tr.find_parent("tr")
            recommended = tr.find("td", class_=lambda x: x and x.startswith("review-value rating-"))
            recommended = recommended.text if recommended else "N/A"
        else:
            recommended = "N/A"


        # Append the data to the DataFrame
        dq_new_row = pd.DataFrame({'Region': [region],'Airline': [airline],'Rating': [rating], 'Title': [title], 'Date': [date], 'Review': [review], 'Date Flown': [date_flown], 'Recommended': [recommended]})
        dq = pd.concat([dq, dq_new_row])

dq.head(3)
Result.
| Date | Region | Airline | Title | Rating | Date Flown | Recommended | Review | |
|---|---|---|---|---|---|---|---|---|
| 1 | 2023-01-23 | Asia | QTR | exceptional | 10 | 2023-01-23 | yes | Trip Verified - … |
| 2 | 2023-01-18 | Asia | QTR | elderly A330 | 5 | 2023-01-23 | no | Trip Verified |… |
| 3 | 2023-01-17 | Asia | QTR | choice of breakfast | 4 | 2023-01-23 | no | Trip Verified |… |
Note: Concatenating Data Vertically.
# Initialize an empty dataframe
df = pd.DataFrame()

# Merge the dataframes on a common column (e.g. 'id')
df = pd.concat([dm, db, du, dq], axis=0)
df.reset_index(drop=True, inplace=True)

# Clean Special Caracter
df['Review'] = df['Review'].str.replace('|', ':', regex=True)

#KPI: Reviews Length
df['Review_Length'] = df['Review'].apply(len)


df.head(3)
Result.
| Date | Region | Airline | Title | Rating | Date Flown | Recommended | Review | |
|---|---|---|---|---|---|---|---|---|
| 1 | 2023-01-23 | Africa | QTR | very unhelpful | 1 | 2022-05-23 | no | Not Verified - … |
| 2 | 2023-01-16 | Africa | QTR | Worst experience | 1 | 2022-12-23 | no | Trip Verified |… |
| 3 | 2023-01-09 | Africa | QTR | loss of our luggage | 1 | 2022-12-23 | no | Trip Verified |… |
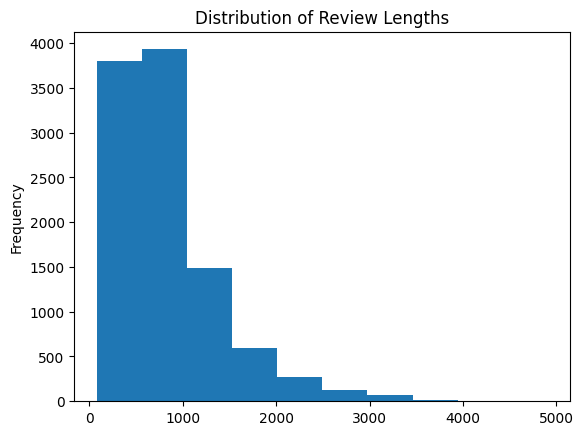
Note: Histogram Plot of the Distribution of Review Lengths.
# Histogram Plot of the Distribution of Review Lengths
df['Review_Length'].plot.hist(bins=10, xlabel='Review Length', ylabel='Number of Reviews',title='Distribution of Review Lengths')

# Show the plot
plt.show()
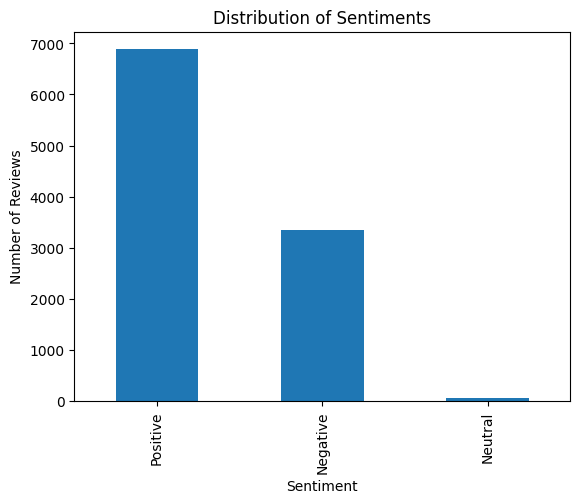
Note: KPI: Reviews Sentiment.
review_sentiments = []
for index, row in df.iterrows():
    review = row["Review"]
    if pd.isnull(review) or review.strip() == "":
        review_sentiments.append(None)
    else:
        polarity = TextBlob(review).sentiment.polarity
        if polarity > 0:
            review_sentiments.append('Positive')
        elif polarity == 0:
            review_sentiments.append('Neutral')
        else:
            review_sentiments.append('Negative')

df['Review_Sentiments'] = pd.Series(review_sentiments)

# Count the number of reviews for each sentiment
sentiment_counts = df['Review_Sentiments'].value_counts()

# Plot the sentiment counts as a bar chart
sentiment_counts.plot.bar(xlabel='Sentiment', ylabel='Number of Reviews',title='Distribution of Sentiments')

# Show the plot
plt.show()
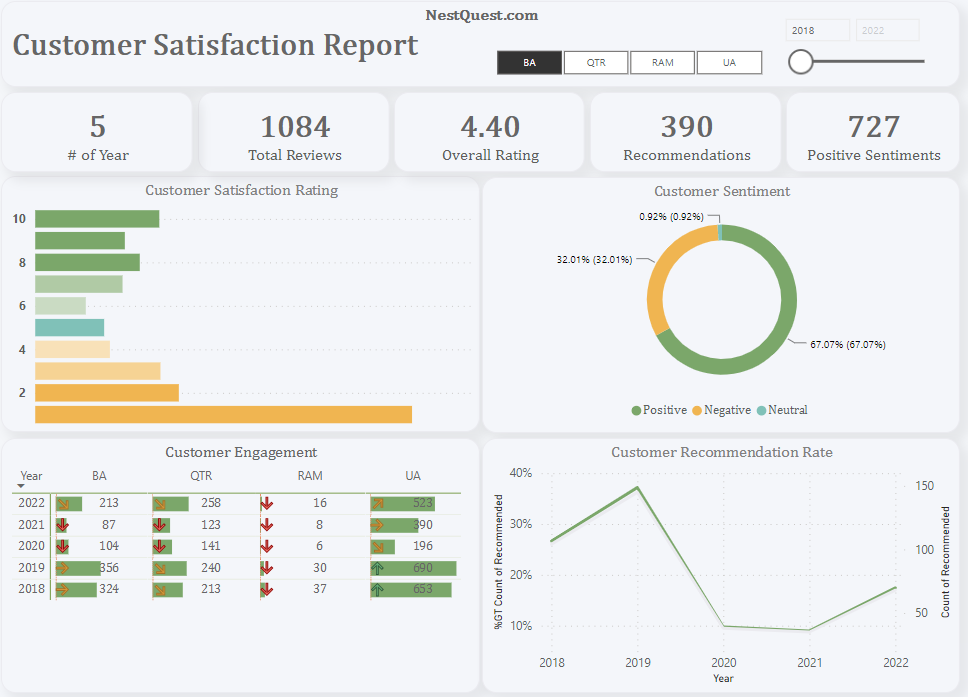
Note: Exporting Data for Analysis with Power BI.
df.to_excel("D:\\airlines_reviews.xlsx", index=False)